
In this article we will describe how to expose Big Data in Oracle Application Express (APEX) using tools/mechanisms provided by Oracle.
Examples are based on:
- Oracle Big Data Lite Virtual Machine – For testing and educational purposes only you can get Big Data Lite virtual machine here.
- Examples in this article are based on data from the Department of Transportation (DOT): https://www.transtats.bts.gov. Please download csv file from here: Prezipped file for January 2018.

Why Oracle Application Express (APEX)?
Oracle APEX is the native application development framework of the Oracle Database and APEX is already included with your Oracle database, so there is no additional licensing cost. Here are a few reasons why you should choose Oracle APEX.
- Easy to use – you can count time from the concept to the prototype in Minutes
- Low Code Development – thanks to the APEX “low-code” capabilities your IT specialists can quickly build applications. Thus, it is money saving.
- Secure – Oracle APEX is designed to build web apps which are highly secure out of the box. APEX follows changing security web standards
- APEX Applications are available in the web browser
- APEX is suitable for both simple and complex business scenarios – dozens of components are ready to work for you and your business
Please visit https://apex.oracle.com/ for more details.
Let’s start
Please use the following credentials to login to the downloaded VM:
- User: oracle
- Password: welcome1
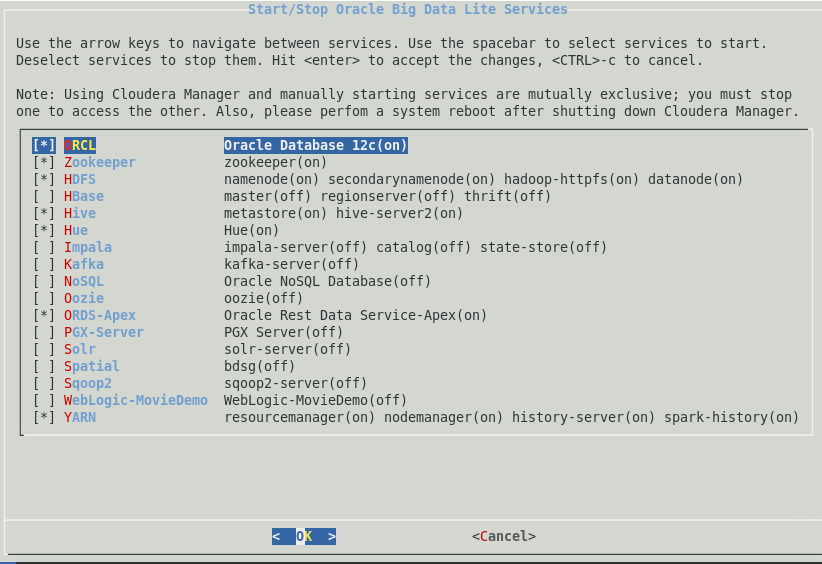
Please Start the following services:
- ORCL – Oracle Database 12c
- ORDS-APEX

Apache Hadoop Tier
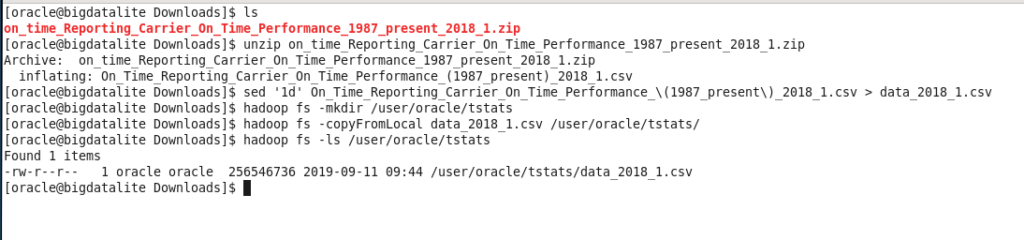
First, let’s prepare downloaded sample transport data by unzipping it and removing header row:
| $ unzip on_time_Reporting_Carrier_On_Time_Performance_1987_present_2018_1.zip $ sed ‘1d’ On_Time_Reporting_Carrier_On_Time_Performance_\(1987_present\)_2018_1.csv > \ data_2018_1.csv |
Now let’s create Hadoop directory for data source files:
| $ hadoop fs -mkdir /user/oracle/tstats |
And copy data file to newly created folder:
| $ hadoop fs -copyFromLocal data_2018_1.csv /user/oracle/tstats/ |
Your terminal window should look similar:
Apache Hive
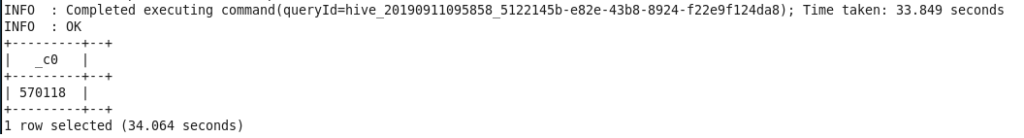
Once we have data in place on Hadoop layer, we can create a Hive table. Please execute bee and run the script ext_trans_stats.htab:
| $ bee > !run ext_trans_stats.htab > select count(*) from ext_trans_stats; |
Here is short listening from ext_trans_stats.htab:
| CREATE EXTERNAL TABLE ext_trans_stats ( Year int, Quarter int, Month int, DayofMonth int, DayOfWeek int, FlightDate date, Reporting_Airline string, … TotalAddGTime int, LongestAddGTime int ) comment “Reporting Carrier On-Time Performance” ROW FORMAT SERDE ‘org.apache.hadoop.hive.serde2.OpenCSVSerde’ WITH SERDEPROPERTIES ( “separatorChar” = “,”, “quoteChar” = “\””) STORED AS TEXTFILE LOCATION ‘hdfs://bigdatalite.localdomain:8020/user/oracle/tstats/’ |
Full script you can find here:
https://github.com/rafalstryjek/Expose-Big-Data-using-Oracle-Application-Express-APEX-/blob/master/ext_trans_stats.htab
Oracle Database
Once we have the Hadoop and Hive part ready, we can then take care of Oracle Database tier. Please login as moviedemo/welcome1
First, we create an External Table, that use ORACLE_HIVE driver to access data on Hadoop file system.
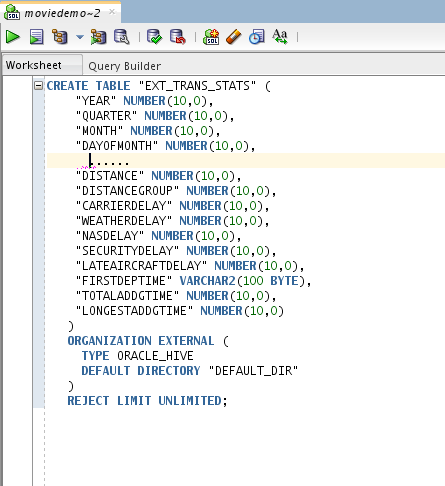
External table script you can find here:
https://github.com/rafalstryjek/Expose-Big-Data-using-Oracle-Application-Express-APEX-/blob/master/ext_trans_stats.sql
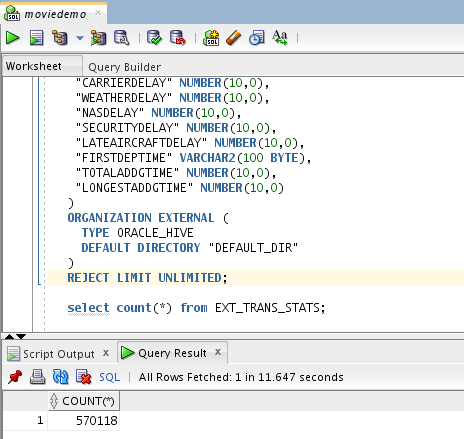
It is as simple as that. You can now query Hadoop data from Oracle Database!
Additionally, in Oracle Database we’ll create two standard lookup tables to see how easy it is to join local data with Hadoop.
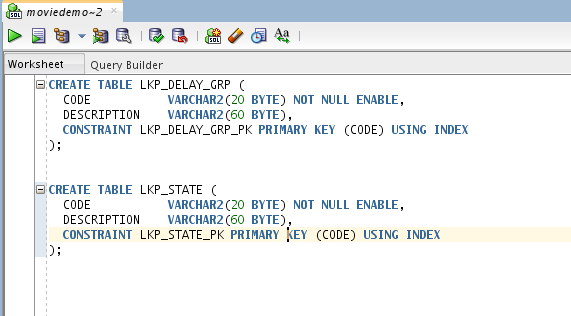
Create lookup tables in the database using the following script:
| CREATE TABLE LKP_DELAY_GRP ( CODE VARCHAR2(20 BYTE) NOT NULL ENABLE, DESCRIPTION VARCHAR2(60 BYTE), CONSTRAINT LKP_DELAY_GRP_PK PRIMARY KEY (CODE) USING INDEX); CREATE TABLE LKP_STATE ( CODE VARCHAR2(20 BYTE) NOT NULL ENABLE, DESCRIPTION VARCHAR2(60 BYTE), CONSTRAINT LKP_STATE_PK PRIMARY KEY (CODE) USING INDEX); |
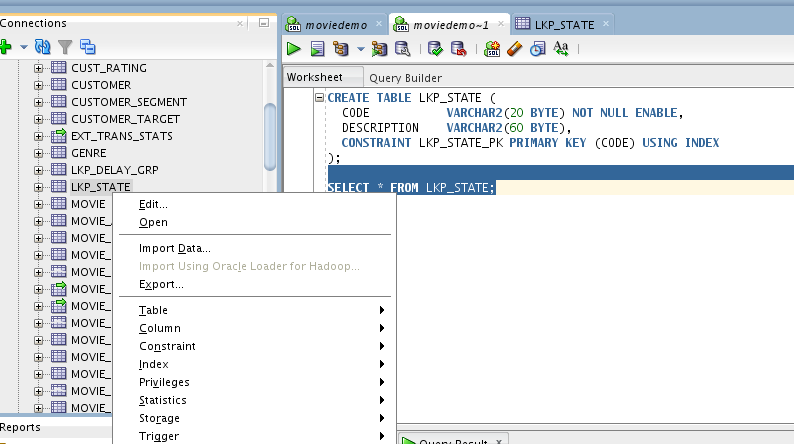
You can find data for lookup tables here: lkp_state, lkp_delay_grp. If your file will be uploaded as a *.csv_ file, then please change the file extension to *.csv.
Download those files and after that you can use ‘Import Data’ in SQL Developer. It works fine.
Oracle APEX Tier
Let’s expose these data to APEX. Oracle Application Express APEX has extensive reporting and data visualisation capabilities. To find more details please visit the website: https://apex.oracle.com/. We will create a simple report and chart.
Open Firefox web browser and use the following credentials:
- http://localhost:7070/ords/apex
- Workspace: moviedemo
- Username: admin
- Password: welcome1
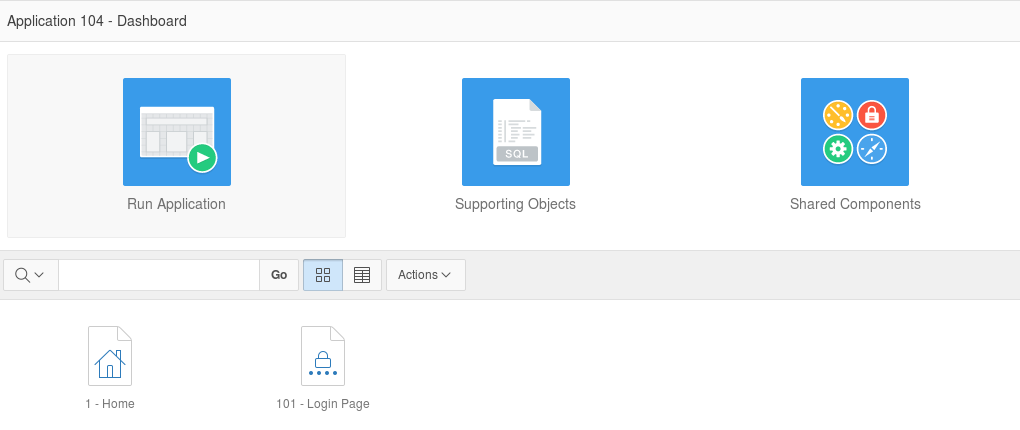
We have created a new Desktop application and called it Dashboard with default settings and 1 Page:
Let’s create the new Page:
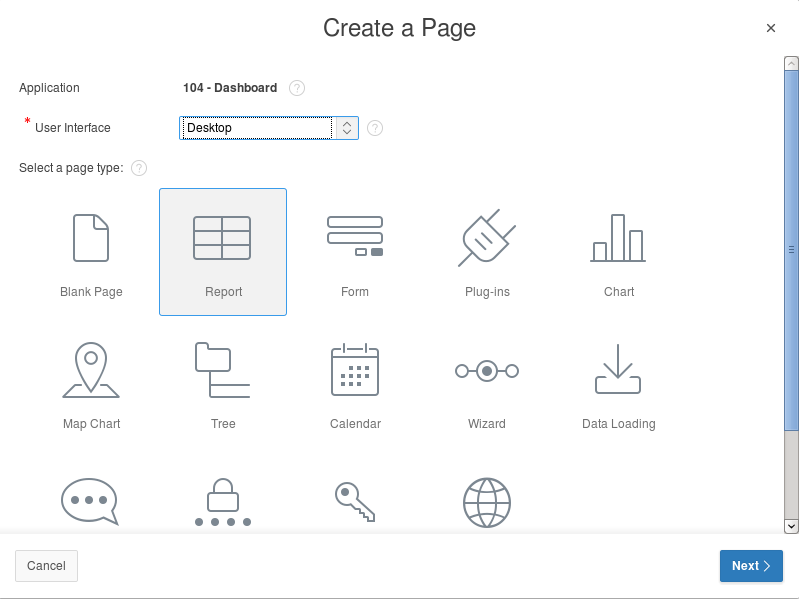
- Click on ‘Create Page’ Button
- Choose Report
- Choose Classic Report
- Page Name: Dashboard
- Region Name: Report 1
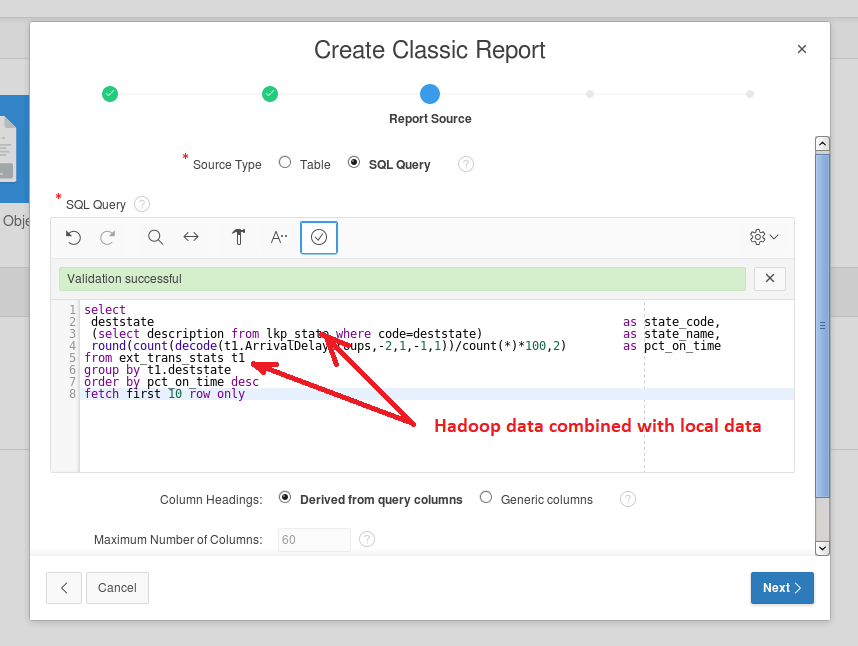
SQL Query for report you can find here:
| SELECT deststate AS state_code, (select description from lkp_state where code=deststate) AS state_name, round(count(decode(t1.ArrivalDelayGroups,-2,1,-1,1))/count(*)*100,2) AS pct_on_time FROM ext_trans_stats t1 GROUP BY t1.deststate ORDER BY pct_on_time desc FETCH FIRST 10 ROW ONLY; |
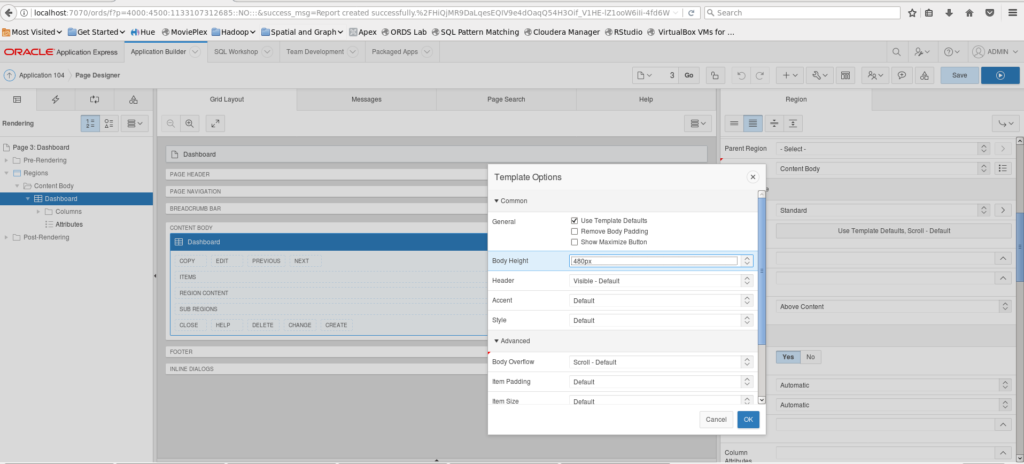
Please set:
| Dashboard Region: Appearance>Template Options: Body Height 480px Grid>Column Span: 4 |
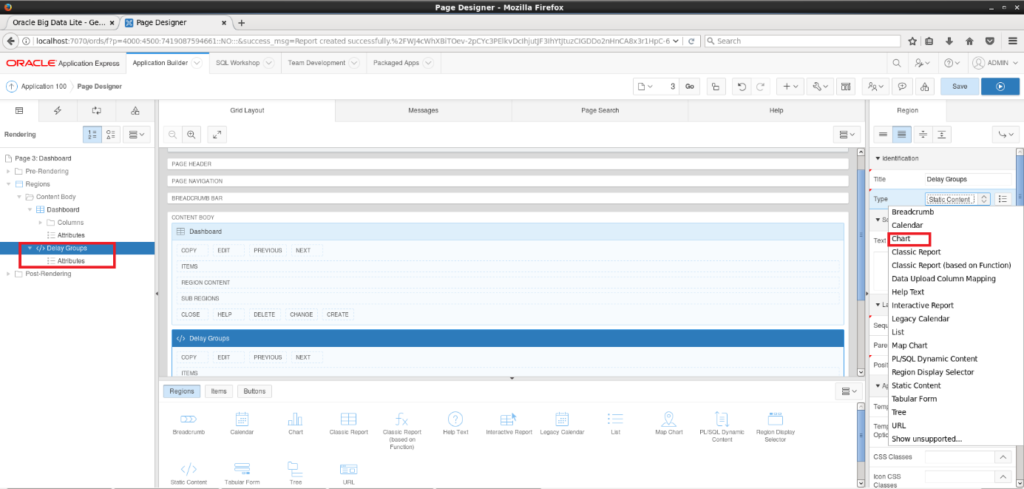
Now let’s add a Chart to the Dashboard Page – create a new Region:
| Change in the created Region: Identification>Title: Delay Group Type>ChartAppearance>Template Options: Body Height 480px Grid> Start New Row: No Delay Group Region Attributes: Chart>Type: Doughnut Appearance>Rendering: Flash Chart Layout>Height: 440px |
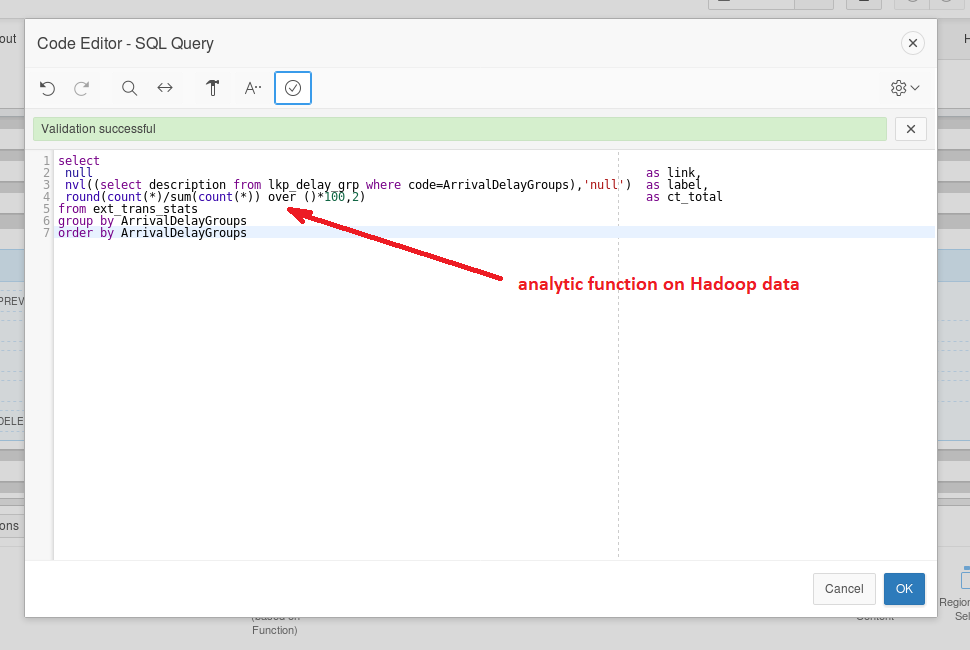
SQL Query for chart you can find here:
| SELECT null AS link, nvl((SELECT description FROM lkp_delay_grp WHERE code=ArrivalDelayGroups) ,’null’) AS label, round(count(*)/sum(count(*)) over ()*100,2) AS ct_total FROM ext_trans_stats GROUP BY ArrivalDelayGroups ORDER BY ArrivalDelayGroups; |
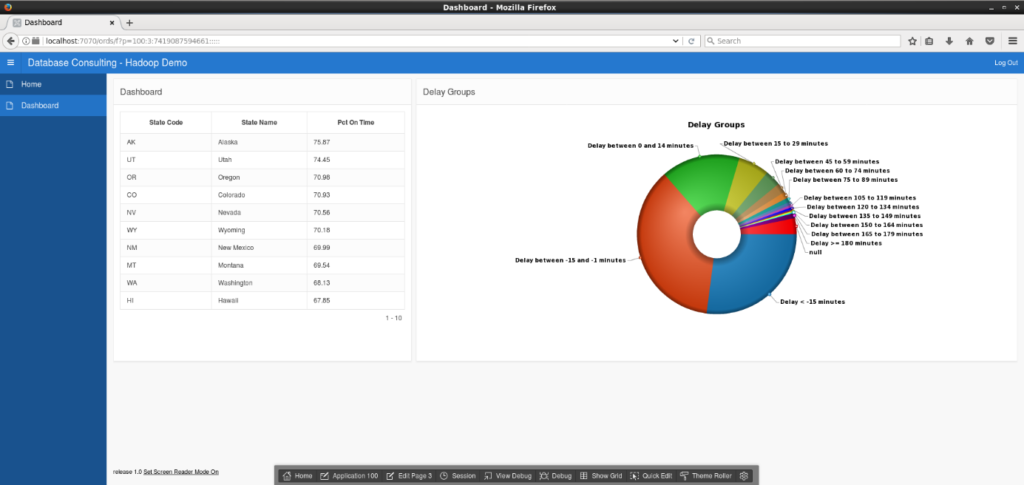
Now we can run the page.
We have chosen Rendering: Flash Chart. If you cannot see the chart, flash player should be installed. After downloading the rpm file:
| [root@bigdatalite Downloads]# rpm -ivh flash-player-npapi-32.0.0.255-release.x86_64.rpm Preparing… ############################### [100%] 1:flash-plugin ############################### [100%] |
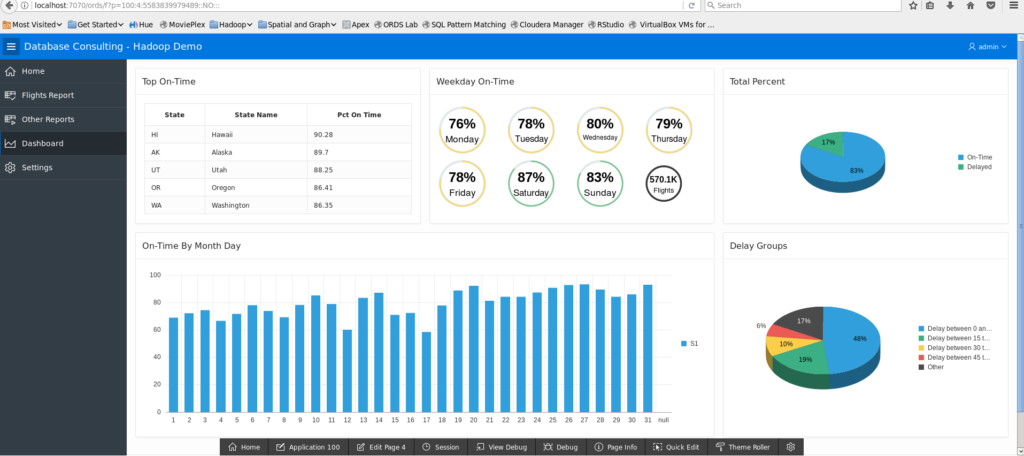
Of course, reports and dashboard could be much more complex. After upgrading APEX to the version 19c on this VM we prepared a sample dashboard. Description of upgrading process is out the scope of this article).
Thank you very much for your time. I hope you enjoyed the easy way that Big Data can be made available in the Oracle Application Express (APEX) app not forgetting, that’s all this has been done using only Oracle mechanisms.
Authors:
Rafal Stryjek
Tomasz Strawski
Special thanks to Marta Wlodarska for expert help with Hive